Home >> Professional >> 3D-BBQ >> PS Results >> Measurement #TOF2

TOF cycle,
measured on 15/11/04 at 14h16.
Q kicker fired every 10 ms,
the strength manually adjusted to minimum.


Beam sound, H plane, 20-times stretched time scale, mono, ca 0.6MB, 26kS/s.
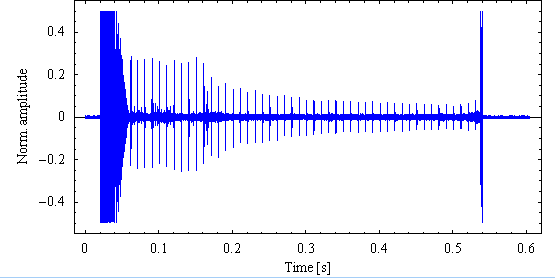


Magnitude spectra of the above signal are shown below for frequencies 50-150kHz. Each spectrum segment (5ms) is normalized separately. This is the reason for red regions for parts with small signal.


Cross-sections of the above plots at the moments specified, linear scale.


Cross-sections of the tune path in log scale. The spectra are normalized to the highest value in the cycle (usually this is at the injection).


Damping rates can be seen in the plots below and the following ones. Here you see magnified beam response for three kicks. It is shown the oscillation normalized magnitude. The time of the record beginning is given on each plot. In the following plots you have records corresponding to one kick.


Damping rates can be seen in the following plots. It is shown the oscillation normalized magnitude. The time of the record beginning is given on each plot.


(c) M.Gasior, CERN-AB-BDI. All rights reserved.