Below are links to sound .wav records, which were produced from the BBQ signal samples.
The sampling rate of the records corresponds exactly to the rate at which the original analog signals were sampled (that is the LHC revolution frequency of 11 245 Hz), so the listened sound is as you would be listening to the original BBQ analog signals.
In the first file the left (L) stereo channel contains a record of beam oscillations in the horizontal plane and the right (R) stereo channel a record of beam oscillations in the vertical plane.
In the second file both stereo channels contain only the record of the horizontal beam oscillations.
In the third file both stereo channels contain only the record of the vertical beam oscillations.
In the fourth special file both stereo channels contain first 1 s of H injection oscillations and then 1 s of V injection oscillations.
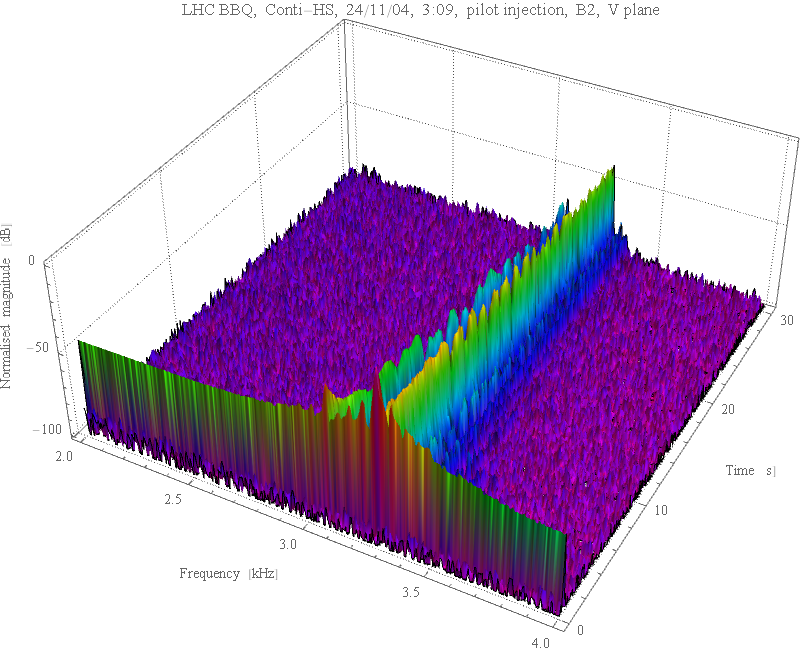
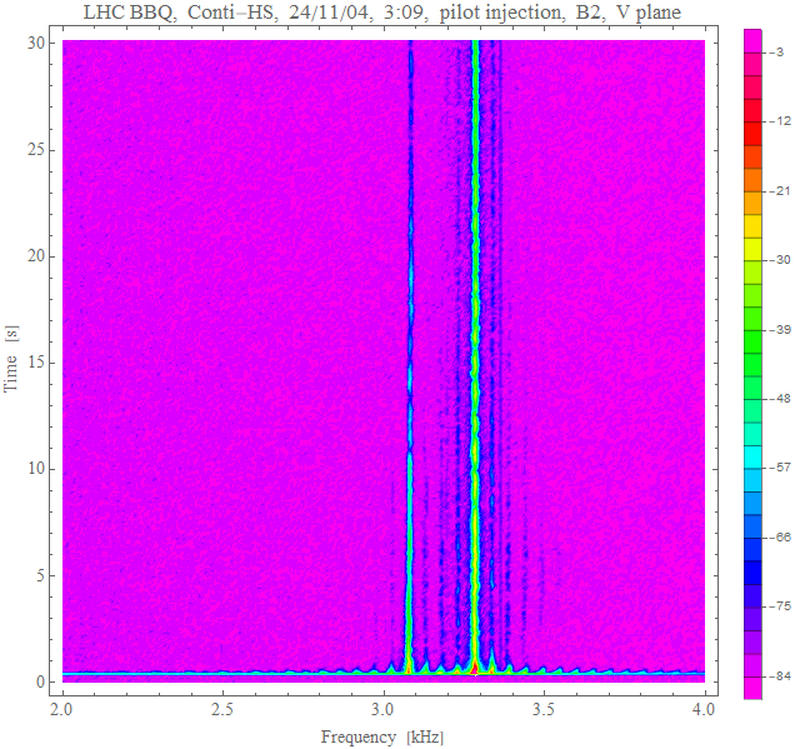
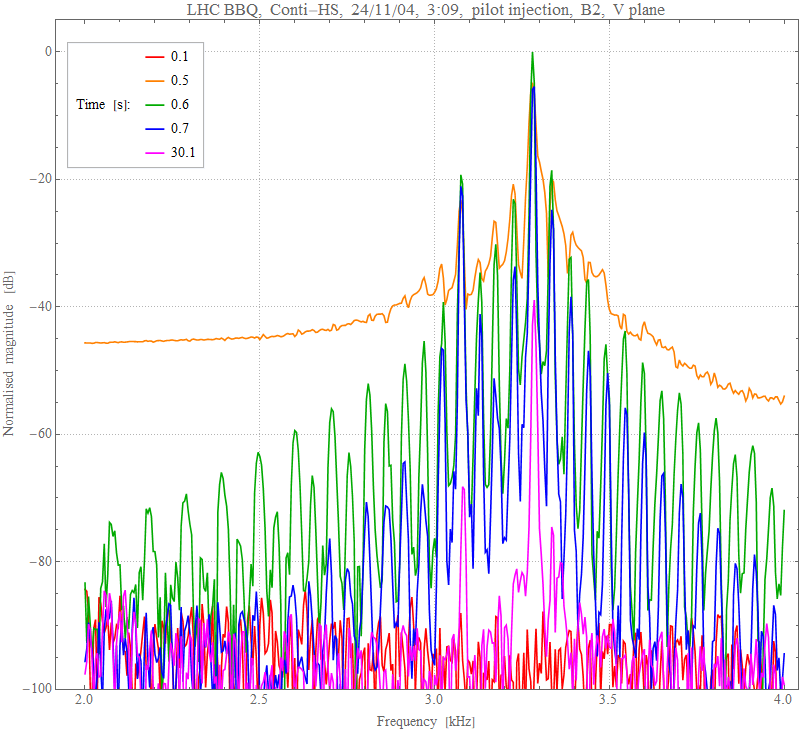
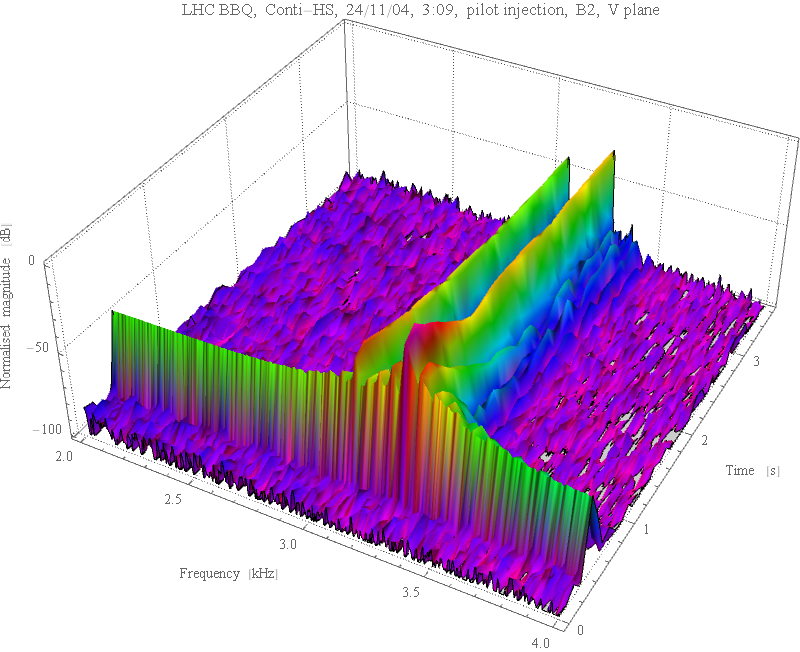
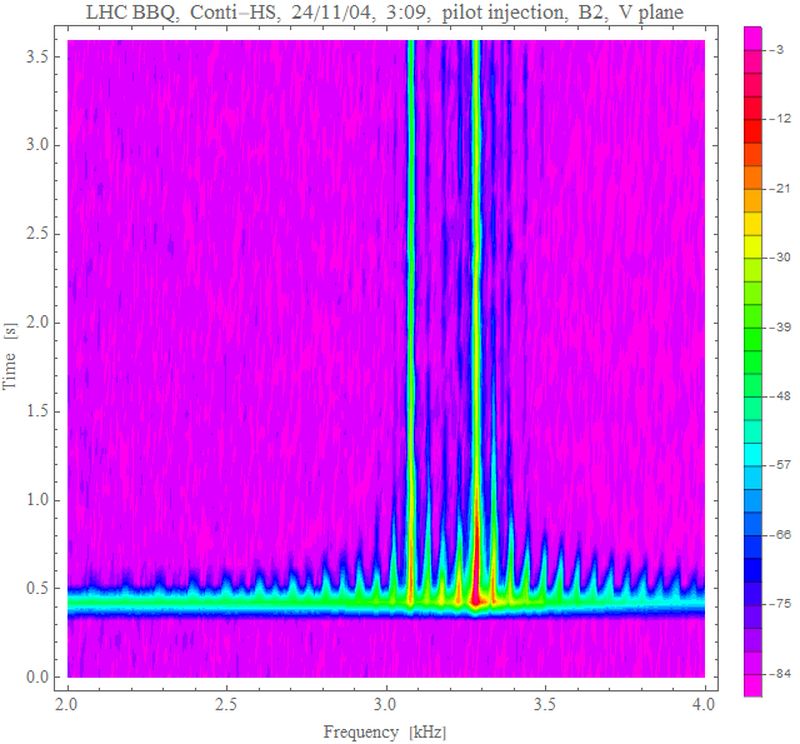
This way you can hear well the frequency difference between the H tune frequency of about 3.1 kHz and the V tune frequency of about 3.3 kHz.
- H+V : both planes, H in L channel, V in R channel
- H : only H plane in both stereo channels
- V : only V plane In both stereo channels
- H and then V : in both stereo channels, first 1 s of H, then 1 s of V
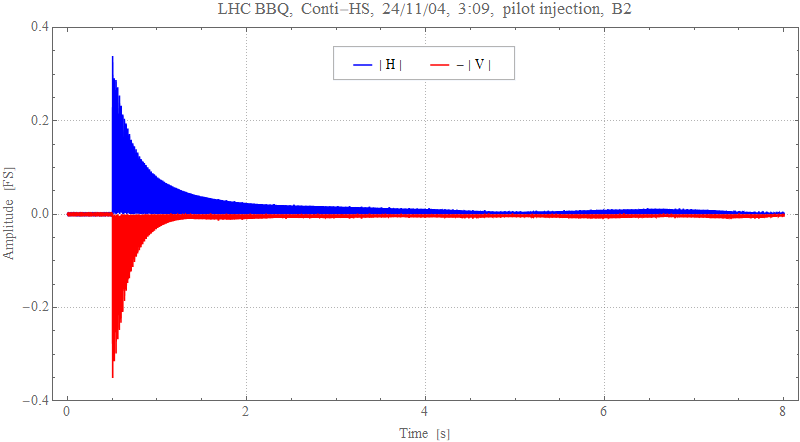
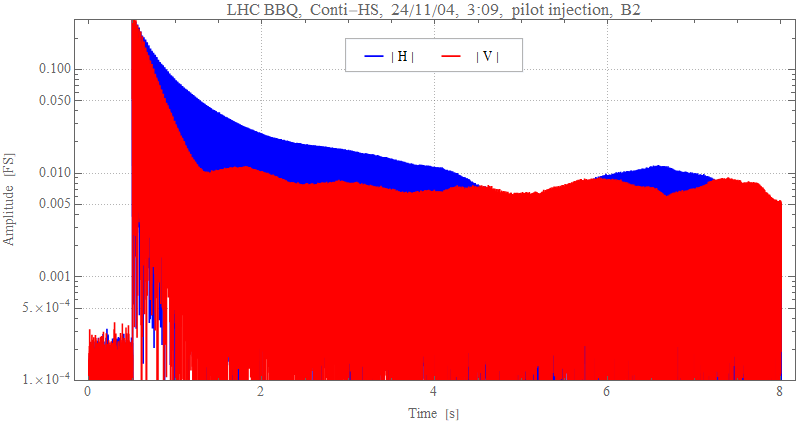
Below are shown plots of the H and V BBQ signal envelopes in linear and logarithmic scales.
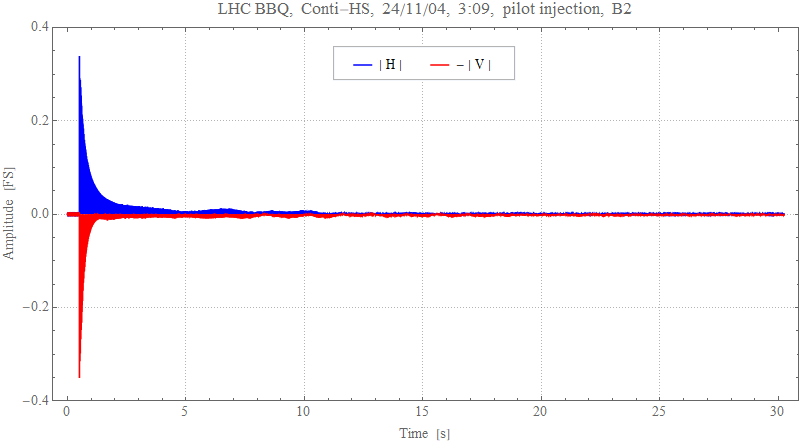
Fig. 1a. Envelopes of the H and V beam oscillation amplitudes.

Fig. 1b. Envelopes of the H and V beam oscillation amplitudes in the logarithmic scale.