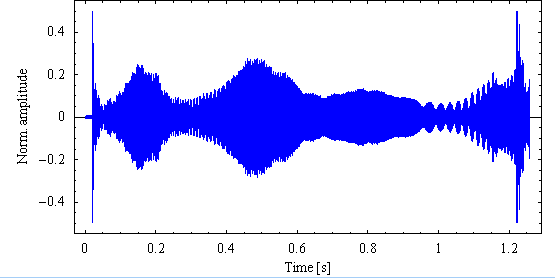
MDSPS cycle,
measured on 5/11/04 at 18h29. No excitation.
I wish I had so much betatron signal for other beams also...
Beam sound, H plane, 20-times stretched time scale, mono, ca 1.3MB, 26kS/s.

|
Home >> Professional >> 3D-BBQ >> PS Results >> Measurement #MDSPS1 |
|
MDSPS cycle, |
|
|
|
|
|
|
|
|