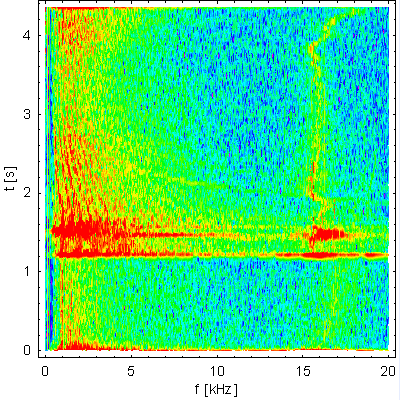
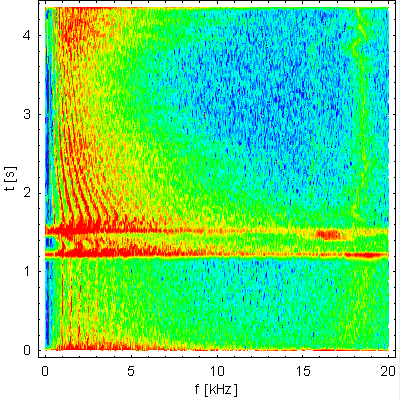
All processing was done on the samples from the .wav file acquired with an external USB sound card Sound Blaster Audigy 2 NX, giving samples with the maximum resolution of 24 bits and the maximum rate of 96 kHz. I used the maximum rate to get as many samples as possible, but, since I had some software problems when dealing with 24-bit samples, I stored 16-bit samples only. I believe that this had no or only little effect on the results quality, since the signals had their own noise, present already on a few 16-bit sample bits. I checked and, as far as noise and interference are concerned, the card gives PERFECT 16-bit samples; no noise, no interference at all!
Below is a link to the recorded .wav file from which I took the samples, which were processed off-line with Mathematica. The left (L) channel contains a record of the signal of the Horizontal (H) plane of the BBQ system and the right (R) channel - of the Vertical (V) plane.
In the foreground you will hear tones corresponding to the synchrotron motion of the beam and in the background - low whistling of the beam betatron motion. Since the betatron frequencies are above 15 kHz, they cannot be heard easily in the original record. For this reason I prepared versions of the record, which are stretched in time 4 times to reduce all frequencies by the same factor. The longer machine cycle helps also to follow what happens with the synchrotron frequencies.
Headphones help a lot to resolve different components.
- Original .wav file (≈ 1.6 MB, 16-bit, 96 kS/s, ≈ 425 kS, 4.4 s)
- 4-times stretched time scale - H plane (≈ 1.6 MB, 24 kS/s)
- 4-times stretched time scale - V plane (≈ 1.6 MB, 24 kS/s)
Below are the signal waveforms: the left and right plots correspond to the BBQ H plane (L channel) and V plane (R channel), respectively.

Fig. 1H. H plane (L channel) signal.

Fig. 1V. V plane (R channel) signal.


