Home >> Professional >> 3D-BBQ >> SPS Results >> Coasting beam #1
Here I present a bizarre resonance occurred when one bunch LHC beam was going coast. It was measured during collimator MDs on 12/10/04 at 0h39. Below is the link to the 87s WAV file (attention: ca 16MB).
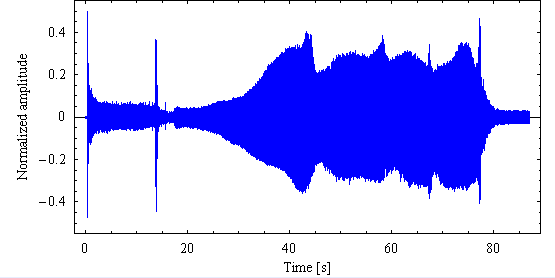
Below are time domain signals.


Fig. 1H. H plane time domain signal.
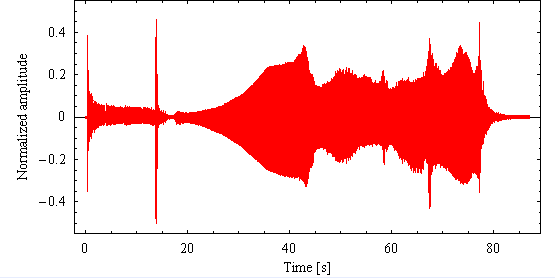


Fig. 1V. V plane time domain signal.


Samples of the H and V signals, sampled with the frequency of fs=48kHz, were divided into segments N=19200 long (t=N/fs=0.4s), with offset m=9600 samples (t=m/fs=0.2s), so each two adjacent sections overlap by 50%. Samples of each segment were Hanning windowed prior to calculating their discrete magnitude spectrum. The bin spacing of the discrete spectra is df=fs/N=2.5Hz.
Since spectra contain many details, for each plain I show separately a general view, the tune path zoomed and magnified synchrotron sidebands of the revolution frequency. I present contour plots and corresponding cross-sections. H plane plots are shown before plots from V plane.


V top | Bottom

H plane contour plots with each spectrum segment normalized separately.


Fig. 2H. H plane magnitude spectra, general view, each spectrum segment normalized separately.


Fig. 3H. H plane magnitude spectra, the tune path zoomed, each spectrum segment normalized separately.


Fig. 4H. H plane magnitude spectra, a zoom on low frequency synchrotron sidebands of the revolution frequency, each spectrum segment normalized separately.


H plane contour plots with all spectra normalized to the highest bin from all segments.


Fig. 5H. H plane magnitude spectra, general view, all spectra normalized to the highest bin from all segments.


Fig. 6H. H plane magnitude spectra, the tune path zoomed, all spectra normalized to the highest bin from all segments.


Fig. 7H. H plane magnitude spectra, a zoom on low frequency synchrotron sidebands of the revolution frequency, all spectra normalized to the highest bin from all segments.


H plane linear spectra, each of which is normalized separately.


Fig. 8H. H plane linear spectra at the moments specified on the plots, each spectrum normalized separately.


Fig. 9H. H plane linear spectra at the moments specified on the plots, each spectrum normalized separately.


Fig. 10H. H plane linear spectra at the moments specified on the plots, each spectrum normalized separately.


H plane log spectra, normalized to the highest bin from all spectrum segments.


Fig. 11H. H plane log spectra at the moments specified on the plots; plots normalized to the highest bin from all spectra.


Fig. 12H. H plane log spectra at the moments specified on the plots; plots normalized to the highest bin from all spectra.


Fig. 13H. H plane log spectra at the moments specified on the plots; plots normalized to the highest bin from all spectra.


Top | Bottom

V plane contour plots with each spectrum segment normalized separately.


Fig. 2V. V plane magnitude spectra, general view, each spectrum segment normalized separately.


Fig. 3V. V plane magnitude spectra, the tune path zoomed, each spectrum segment normalized separately.


Fig. 4V. V plane magnitude spectra, a zoom on low frequency synchrotron sidebands of the revolution frequency, each spectrum segment normalized separately.


V plane contour plots with all spectra normalized to the highest bin from all segments.


Fig. 5V. V plane magnitude spectra, general view, all spectra normalized to the highest bin from all segments.


Fig. 6V. V plane magnitude spectra, the tune path zoomed, all spectra normalized to the highest bin from all segments.


Fig. 7V. V plane magnitude spectra, a zoom on low frequency synchrotron sidebands of the revolution frequency, all spectra normalized to the highest bin from all segments.


V plane linear spectra, each of which is normalized separately.


Fig. 8V. V plane linear spectra at the moments specified on the plots, each spectrum segment normalized separately.


Fig. 9V. V plane linear spectra at the moments specified on the plots, each spectrum segment normalized separately.


Fig. 10V. V plane linear spectra at the moments specified on the plots, each spectrum normalized separately.


V plane log spectra, normalized to the highest bin from all of spectrum segments.


Fig. 11V. V plane log spectra at the moments specified on the plots; plots normalized to the highest bin from all spectra.


Fig. 12V. V plane log spectra at the moments specified on the plots; plots normalized to the highest bin from all spectra.


Fig. 13V. V plane log spectra at the moments specified on the plots; plots normalized to the highest bin from all spectra.


Top | V top
(c) M.Gasior, CERN-AB-BDI. All rights reserved.