Home >> Professional >> 3D-BBQ >> SPS Results >> Lo & Hi intensity
Here I present a comparison of two measurements done on 2/11/04 with no explicit excitation. Each measurement covers two consecutive SPS cycles. First was with one bunch LHC pilot (intensity ca 5e9), referred to as the low intensity (LI) beam, and the second was normal fixed target cycle, referred to as the high intensity (HI) beam. I cut out a bit of silence between the two cycles. The first measurement (13h15) was done with the BBQ minimal gain of 30dB, and the second (13h03) - with the gain increased by 45dB (by a factor of 180) to 75dB. The goal was to study the BBQ behavior when processing low and high intensity beams with the same front-end gain. When the gain is adjusted to the HI beam, the LI one is barely seen; if the gain is adjusted to the LI beam, processing of the HI beam leads to deep saturation effects. In the case presented, the HI signal is clamped at a percent of its original amplitude. What was seen is that the BBQ is capable of working properly in either case, giving comparable results. The only difference is that more interference is seen with the smaller gain.

Below are links to the WAV files. In the first record done with the 30dB gain you can hear the LI beam only with headphones. In the second one, done with the 75dB gain, you can hear clearly the LI beam. Saturation effects on the HI beam lead to heavy sound distortions. Nevertheless, the corresponding spectra still carry the betatron frequency information. The most important conclusion is that the BBQ concept is very robust for saturations. The other is that with 16-bit acquisition system one can clearly see even very small components. First I show H plane results with the smaller gain (left) and H plane results with the larger gain (right). Plots for V plane will follow.

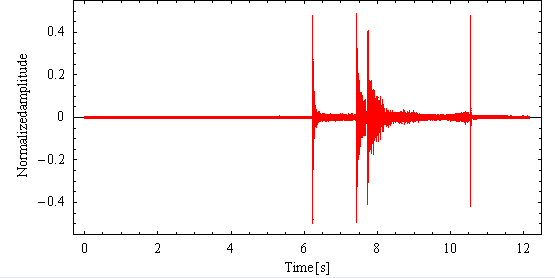
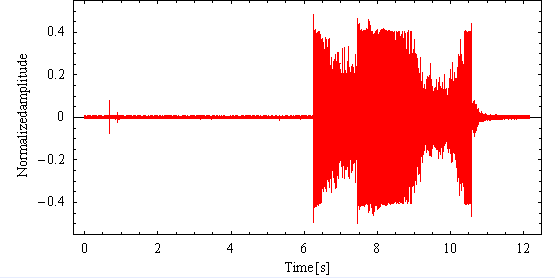
Below are time domain signals. The LI beam is not seen on the small gain measurement. The HI beam signal is clamped in the front-end during most of the higher gain measurement.
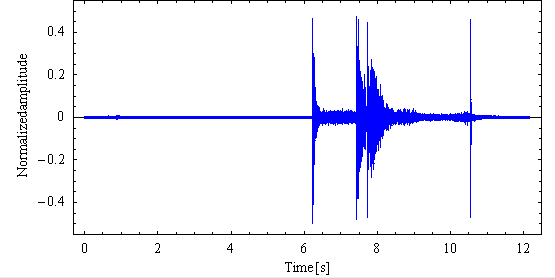


Fig. 1a. H plane time domain signal, small gain.
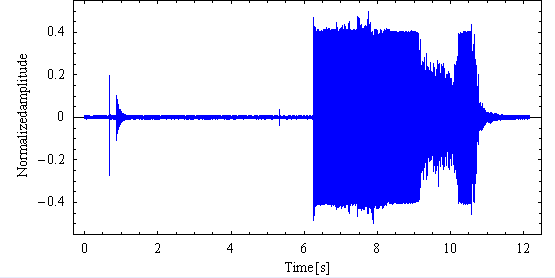


Fig. 1b. H plane time domain signal, large gain.
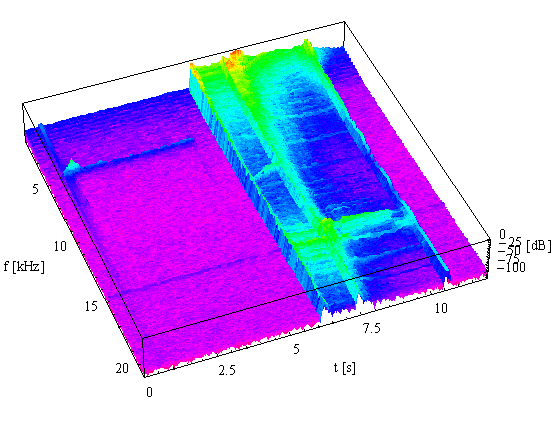


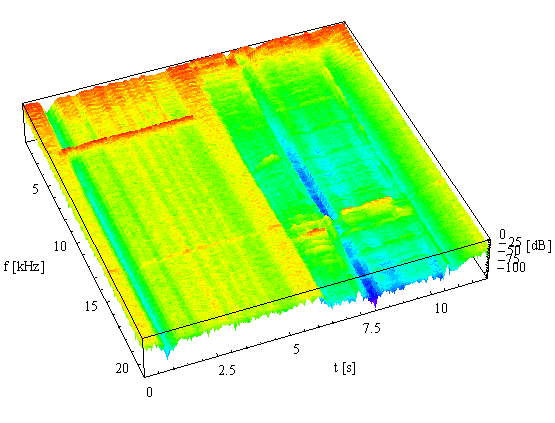
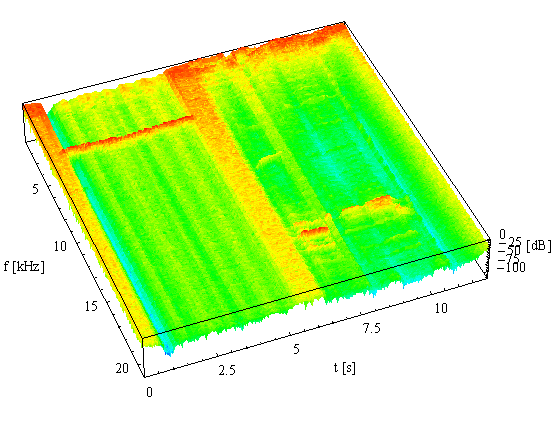
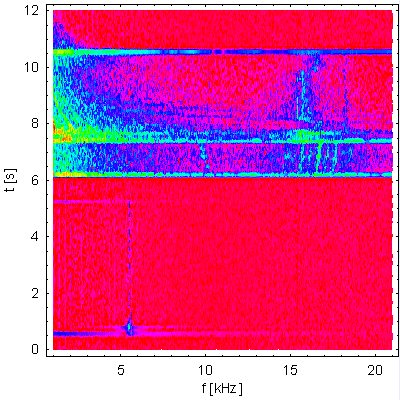
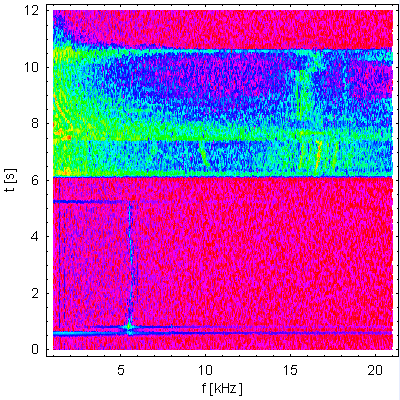
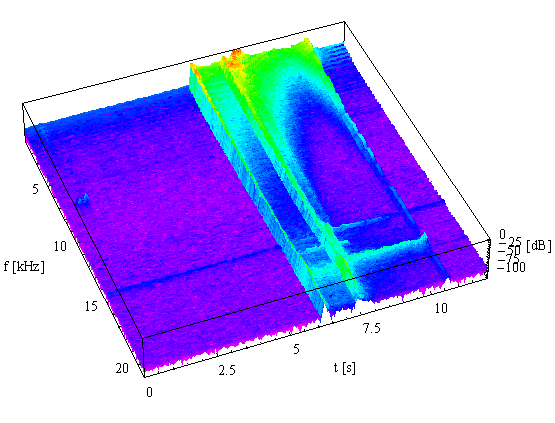
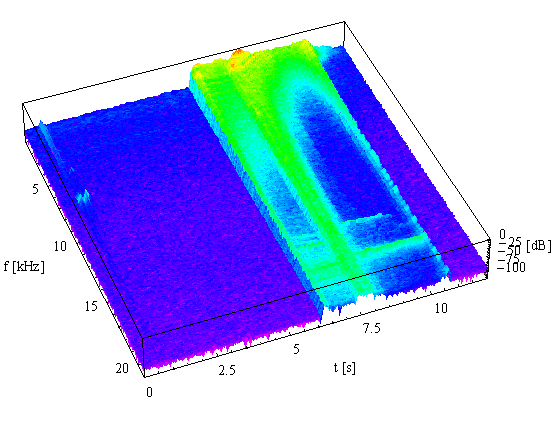
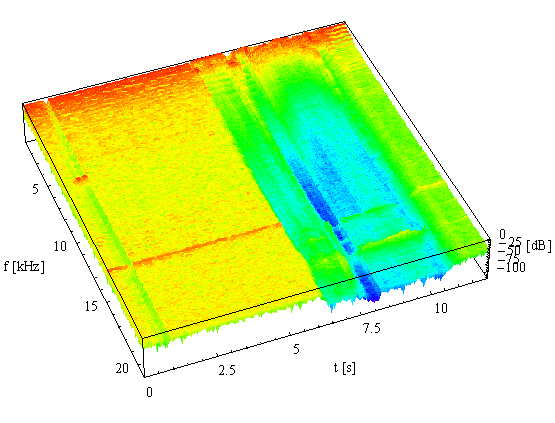
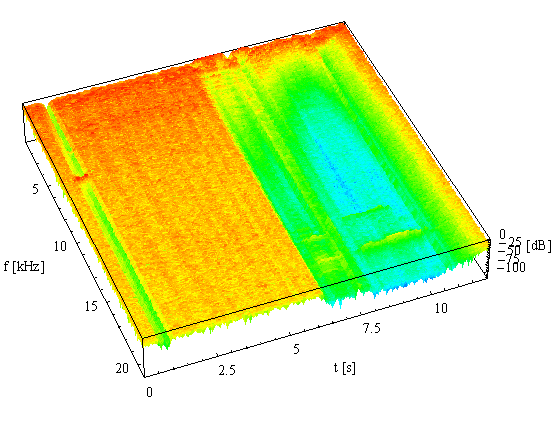
Samples of the H and V signals, sampled with the frequency of fs=96kHz, were divided into segments N=19200 long (t=N/fs=0.2s), with offset m=9600 samples (t=m/fs=0.1s), so each two adjacent sections overlap by 50%. Samples of each segment were Hanning windowed prior to calculating their discrete magnitude spectrum. The bin spacing of the discrete spectra is df=fs/N=5Hz.
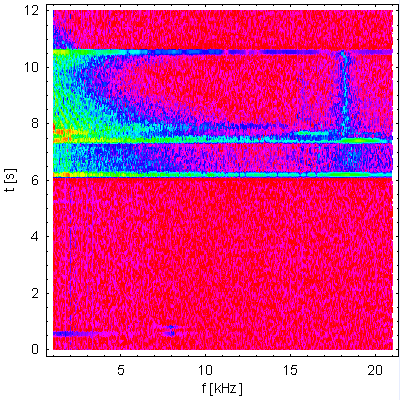
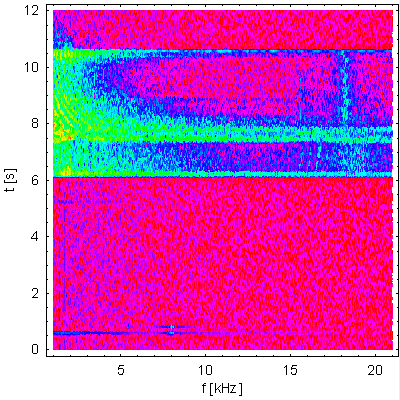
Spectra in plots below are normalized to the highest bin.


Fig. 2a. H plane magnitude spectra, small gain (30dB).


Fig. 2b. H plane magnitude spectra, large gain (75dB).


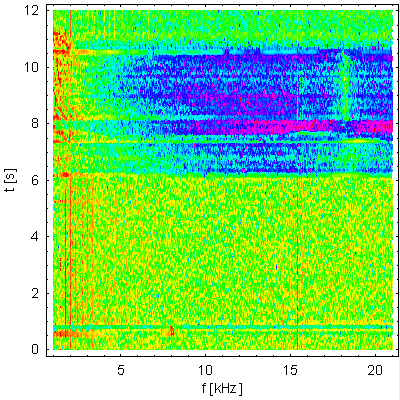
Fig. 3a. H plane magnitude spectra, small gain. Each spectrum segment is normalized separately.


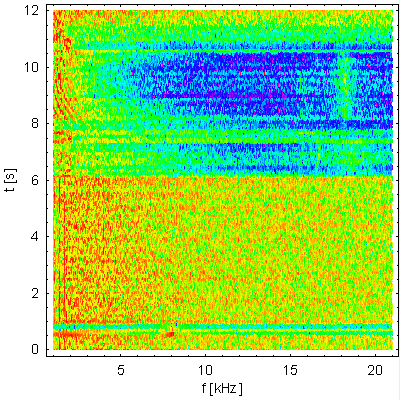
Fig. 3b. H plane magnitude spectra, large gain. Each spectrum segment is normalized separately.


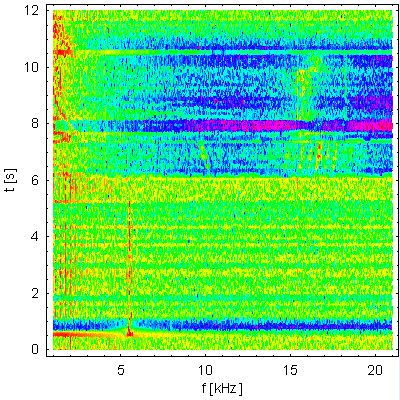
Fig. 4a. Contour plot corresponding to Fig. 2a. Small gain.


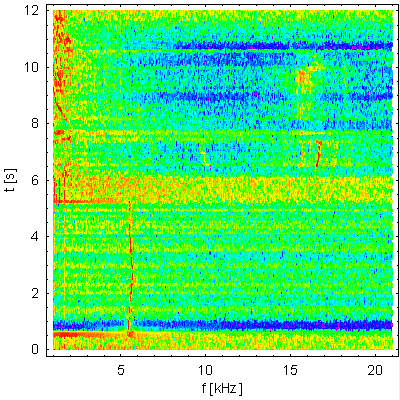
Fig. 4b. Contour plot corresponding to Fig. 2b. Large gain.


Fig. 5a. Contour plot corresponding to Fig. 3a. Small gain.


Fig. 5b. Contour plot corresponding to Fig. 3b. Large gain.


Fig. 6a. Log scale cross-sections of plots in Fig. 2a and 4a in moments specified on the plots. Small gain.


Fig. 6b. Log scale cross-sections of plots in Fig. 2b and 4b in moments specified on the plots. Large gain.


Top | Bottom

Here I show the corresponding plots for the V planes from both measurements.

Below are time domain signals.


Fig. 7a. V plane time domain signal, small gain.


Fig. 7b. V plane time domain signal, large gain.
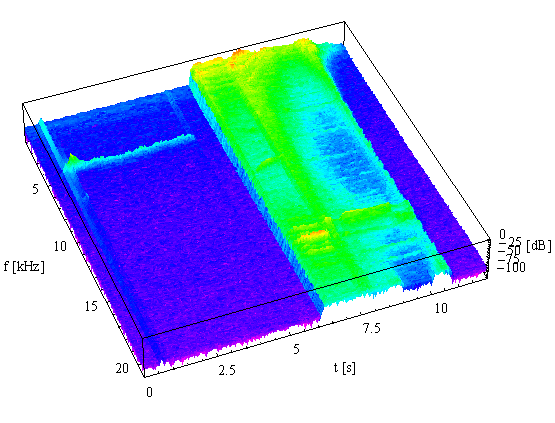


Note that for the LI beam on the V plane tune paths are seen only during some time after injection. As soon as acceleration starts, there are no signs of tune paths.


Fig. 8a. V plane magnitude spectra, small gain (30dB).


Fig. 8b. V plane magnitude spectra, large gain (75dB).


Fig. 9a. V plane magnitude spectra, small gain. Each spectrum segment is normalized separately.


Fig. 9b. V plane magnitude spectra, large gain. Each spectrum segment is normalized separately.


Fig. 10a. Contour plot corresponding to Fig. 8a. Small gain.


Fig. 10b. Contour plot corresponding to Fig. 8b. Large gain.


Fig. 11a. Contour plot corresponding to Fig. 9a. Small gain.


Fig. 11b. Contour plot corresponding to Fig. 9b. Large gain.


Fig. 6a. Log scale cross-sections of plots in Fig. 9a and 11a in moments specified on the plots. Small gain.


Fig. 6b. Log scale cross-sections of plots in Fig. 9b and 11b in moments specified on the plots. Large gain.


Top | V plane plots

(c) M.Gasior, CERN-AB-BDI. All rights reserved.