Home >> Professional >> 3D-BBQ >> SPS Results >> 50Hz lines measurement #1
On many measurements there were observed strange lines in the beam spectrum. They were spaced by multiples of 50Hz, sometimes with stronger pattern every 100Hz or 300Hz. They appeared mostly on the H plane in vicinity of the tune path, but they were not sidebands of the tune. They are believed to originate from dipole magnet ripple.
Here I present a measurement intended to show that the strange 50Hz lines are indeed in the beam spectrum. The measurement was done during collimator MDs on 4/10/04 at 22h06. It was one LHC batch coasting beam (72 bunches, ca 1e11 each). No explicit excitation.

Below is the link to the WAV file with the signal time domain record. You can hear that after some 12s the tune whistling slightly decreases. This is because the tune was taken from one of the "resonance" 50Hz lines and the betatron oscillations got smaller.
Below are time domain signals.
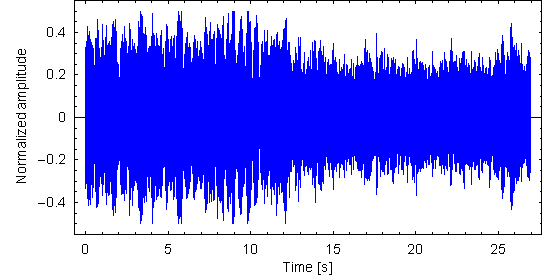


Fig. 1H. H plane time domain signal.
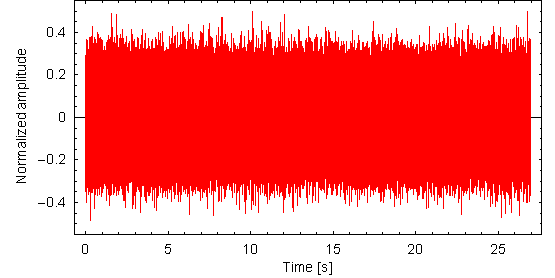


Fig. 1V. V plane time domain signal.
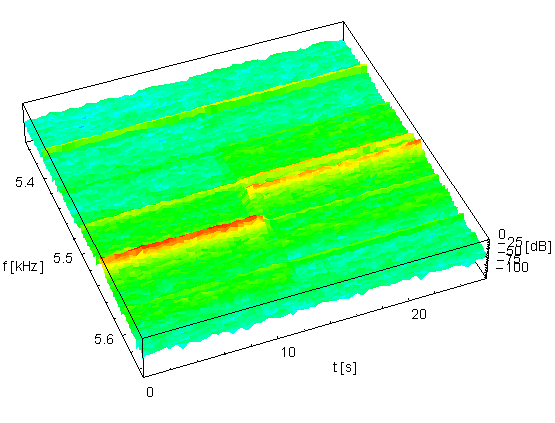


Samples of the H and V signals, sampled with the frequency of fs=48kHz, were divided into segments N=48000 long (t=N/fs=1s), with offset m=24000 samples (t=m/fs=0.5s), so each two adjacent sections overlap by 50%. Samples of each segment were Hanning windowed prior to calculating their discrete magnitude spectrum. The bin spacing of the discrete spectra is df=fs/N=1Hz.
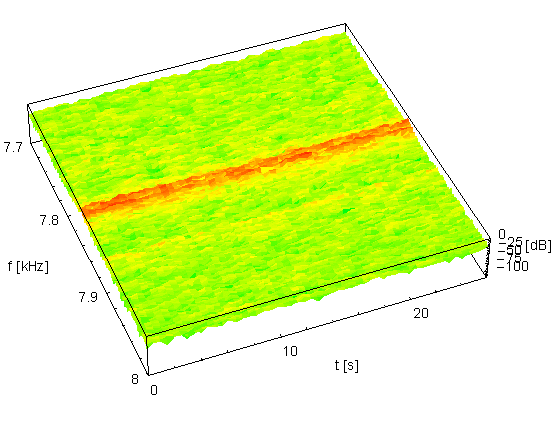
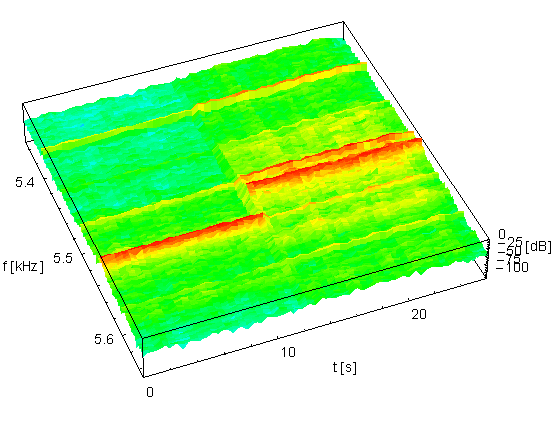
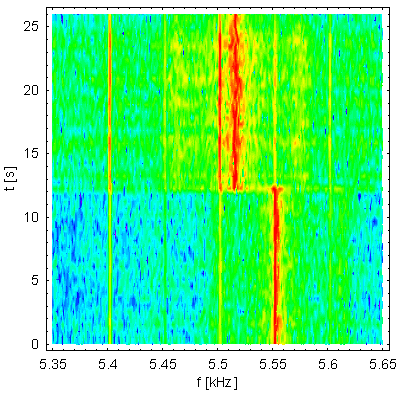
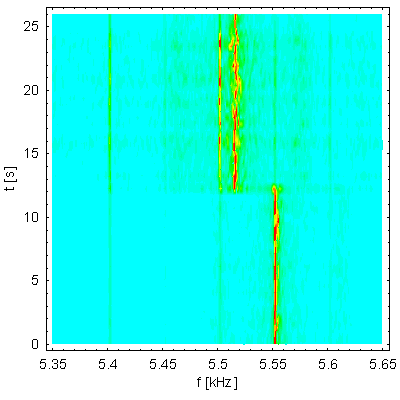
Below I show H and V plane spectra. On H spectra it is seen a tune change by some 40Hz (ca 1e-3). There are seen a few strange lines, spaced by 50Hz or 100Hz, which do not move with the tune path, but they get smaller or larger, depending the tune path location. Therefore, they look as strong resonances in the beam spectrum.
Look on the time domain signal. Once the tune was moved from one of the lines, the betatron oscillation amplitude decreased! Also the dynamics of the self-excited oscillations changed: the time domain record is smoother once the tune is not sitting exactly on one of the 50Hz lines.
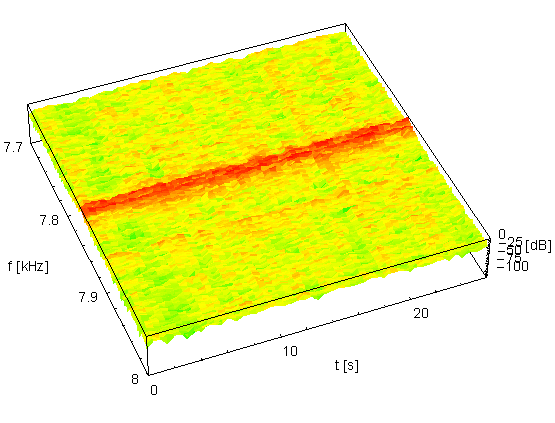
On V plane there is seen only one line, which looks as a synchrotron sideband.


Fig. 2H. H plane magnitude spectra. Each segment is normalized to the highest value.


Fig. 2V. V plane magnitude spectra. Each segment is normalized to the highest value.


The spectra in the figures below are similar to the ones in Fig. 2H and 2V. The only difference is that now each segment spectrum is normalized separately.


Fig. 3H. H plane magnitude spectra. Each segment is normalized separately.


Fig. 3V. V plane magnitude spectra. Each segment is normalized separately.


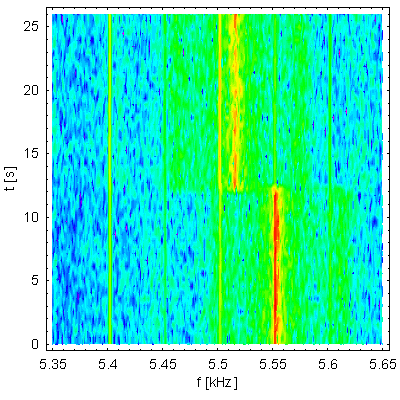
The figures below show contour plots corresponding to the spectra in Fig. 2H and 2V. On H spectra there are seen some traces of the synchrotron sidebands, spaced by some 60Hz from the tune. The same separation is seen for the line on the V spectra.


Fig. 4H. Contour plot of H plane magnitude spectra of Fig. 2H


Fig. 4V. Contour plot of V plane magnitude spectra of Fig. 2V


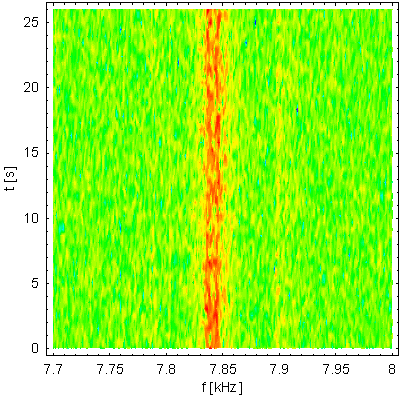
The figures below show contour plots corresponding to the spectra in Fig. 3H and 3V (each spectrum segment normalized separately).


Fig. 5H. Contour plot of H plane magnitude spectra of Fig. 3H


Fig. 5V. Contour plot of V plane magnitude spectra of Fig. 3V


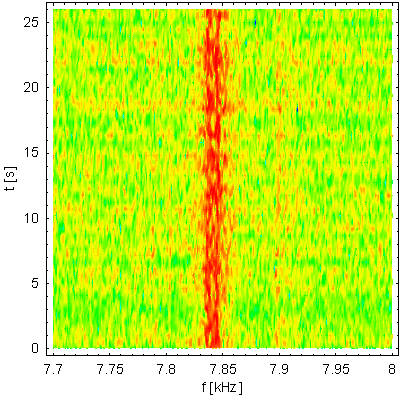
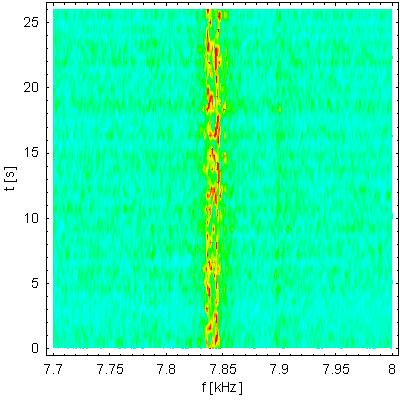
The figures below show contour plots with linear color scaling. It looks as the V tune path is composed of two lines, spaced by some 10Hz. The phenomenon was observed many times.


Fig. 5H. Linear scale contour plot of H plane spectra.


Fig. 5V. Linear scale contour plot of V plane spectra.


The figures below show linear scale magnitude spectra at times specified on the plots.


Fig. 6H. H spectra at the times specified on the plots. They correspond to cross-sections of the tune paths on spectra segments normalized separately (Fig. 3H). Note the linear vertical scale.


Fig. 6V. V spectra at the times specified on the plots. They correspond to cross-sections of the tune paths on spectra segments normalized separately (Fig. 3V). Note the linear vertical scale.


The figures below show log scale magnitude spectra at times specified on the plots. There are seen synchrotron sidebands (ca 60Hz apart the tune peak)


Fig. 7H. H spectra at the times specified on the plots. They correspond to cross-sections of the tune paths on spectra segments normalized to the highest value (Fig. 2H).


Fig. 7V. V spectra at the times specified on the plots. They correspond to cross-sections of the tune paths on spectra segments normalized to the highest value (Fig. 2V).


(c) M.Gasior, CERN-AB-BDI. All rights reserved.