The presented meaurement was done with this development system and a soundcard, during one of our visits at BNL. Its subject is a RHIC cycle, from injections, through energy ramp and squeeze. Below I present a description of the measurement, based on an email (Subject: RHIC injection/ramp/squeeze as seen/heard by the BBQ) I sent to people from BNL. In addition to the original content I provide explanations for therms otherwise obvious in the trade.
The discussed measurement was done on 18/03/05, around 12h30, with the prototype of the Base-Band Q (BBQ) measurement system. The measurement lasts about 9 minutes, from injection, through ramp, squeeze, and ends up with switching the RHIC Radio Frequency (RF) system to 200 MHz system (if I remember well). All these things can be distinguished in the BBQ time domain record. The record is a .wav sound file, 16-bit, 96 kS/s, captured with a 150 $ PC sound card. Due to the file size (some 300 MB) I could not put it on the web. Furthermore, since betatron frequencies are around 18 kHz, they are hardly audible. To deal with the size and high frequencies, I re-sampled the record at the rate of 8 kS/s, reducing the file size and all frequencies by a factor of 12 (file size still some 26 MB). The record lasts 9’ 20". On the beginning you hear injections, composed of 4-bunch batches; the last one is 2-bunches, then mains ripple during the ramp, IPM and tune kicker firing, and other activities, for which I do not know the machine enough to link them to anything in particular.
This is the link to the re-sampled 8 kS/s .wav file (9’ 20", 26 MB).
Left channel is connected to the horizontal (H) plane, and the right - to the vertical (V) plane. Headphones recommended.
If you do not feel like listening to the whole record, these are the milestones, in case you want to go straight to your favourite piece:
- Beginning - injections: 10 batches of 4 bunches and one batch of 2 bunches at the end, 42 bunches in total.
- 1’ 40" - Increased tune oscillations.
- 2’ 15" - IPM fires every 4 s (longer sound), followed by the tune kicker (some 2 s after the IPM), this seems to continue throughout the whole ramp and squeeze. You hear the IPM better on V than on H, since the beta of our pick-up is larger for V by a factor of 3. The tune kicker fires first in V, then in H.
- 2’ 55" - Beginning of the ramp, you hear beam oscillations driven by the mains ripple on the dipoles; this is why it is more pronounced in the H plane (L channel). On V the ripple is present due to the plane coupling.
- 3’ 40" - Increased tune oscillations on V;
- 4’ 20" - ramp end;
- 4’ 28" - betatron oscillations lasting longer after the IPM fires (V plane);
- 5’ 20" - betatron oscillations lasting longer after the IPM fires (V plane);
- 8’ 35" - tune kicker off.
- 8’ 40" - An RF operation; probably they shake bunches in the bucket before switching the RF to 200 MHz; the strong whistling is related to the synchrotron frequency harmonics; it is much louder in H.
- 9’ 10" - Whistling goes away, probably after switching to the 200 MHz RF. After this collisions start.
Injection of one batch in full bandwidth (96 kS/s, 1.5 s, 0.5 MB).
Due to the record size, I could not process it all to select more interesting part. Instead, from the original 96kS/s record I cut-out 95 pieces containing IPM-triggered oscillations. Each piece is 0.4 s long and IPM fires every 4 s, so I compressed the time axis by a factor of 10, cutting out 3.6 s between parts with IPM activity. Note that sometimes betatron oscillations significantly increase after the kick.
This is the re-sampled (8 kS/s) .wav file with selected IPM activity (38 s = 95 * 0.4 s, 1.2 MB).
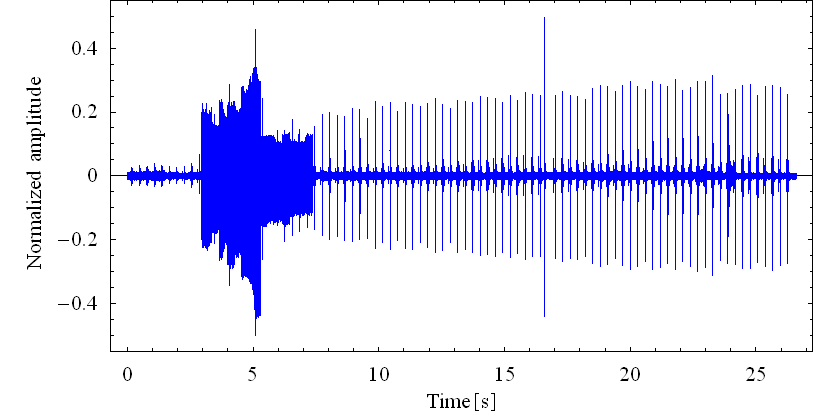
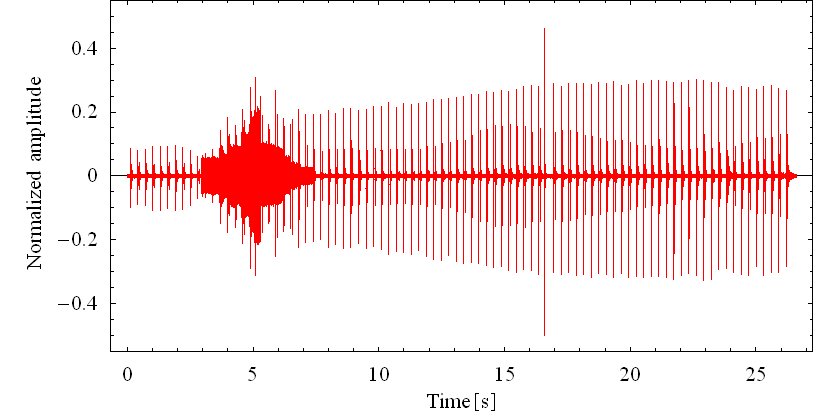
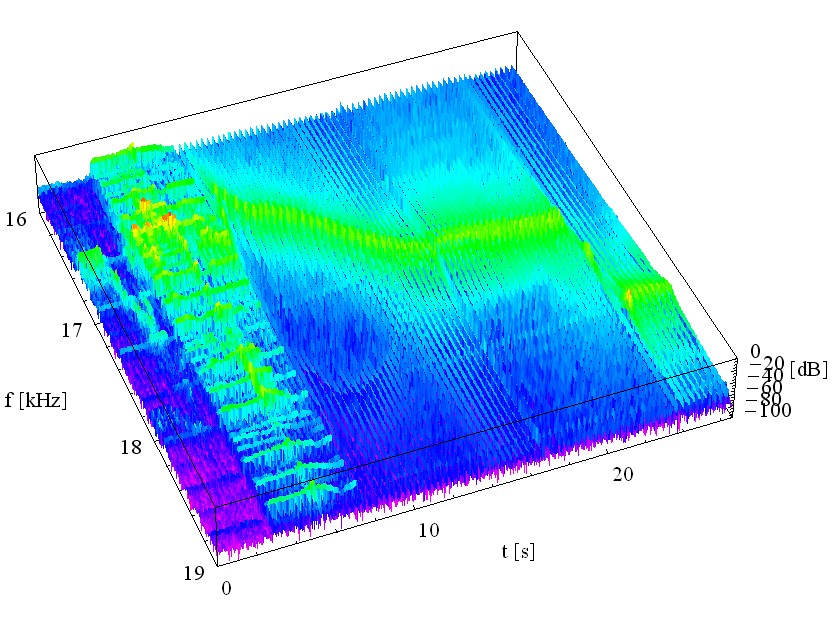
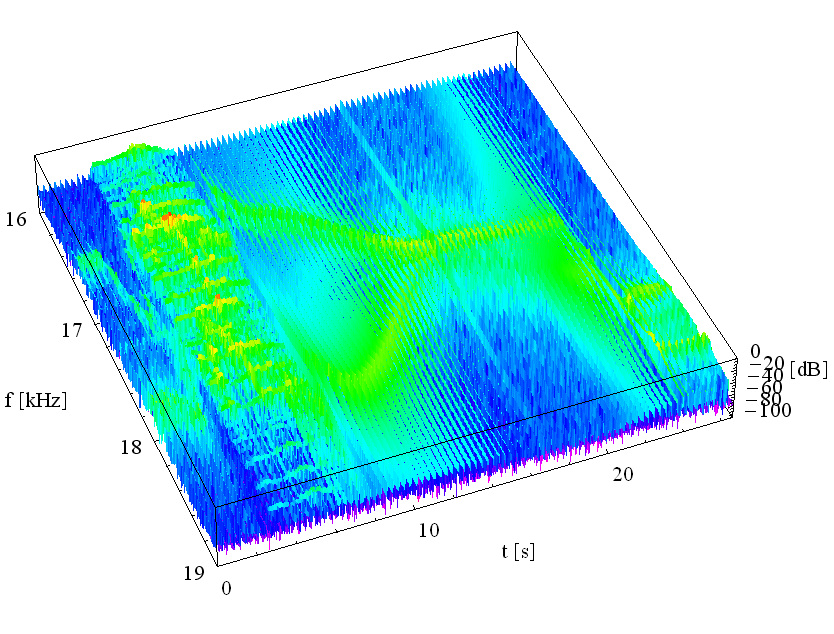
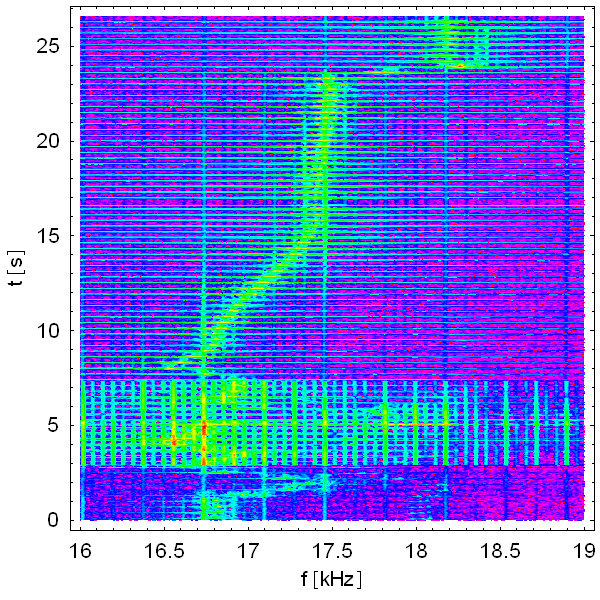
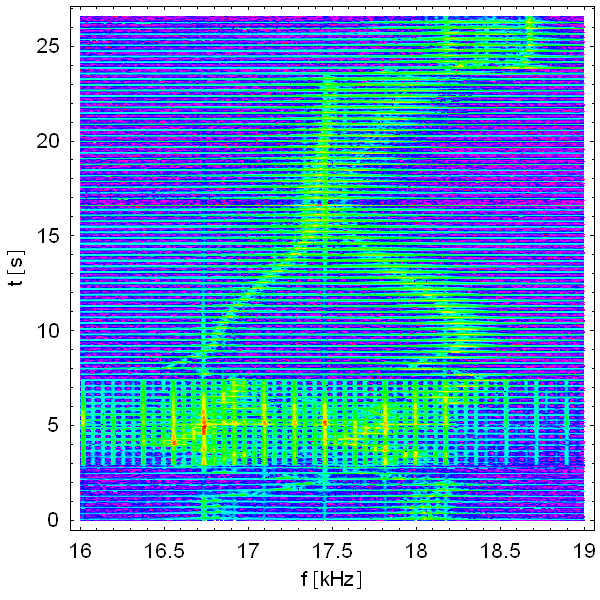
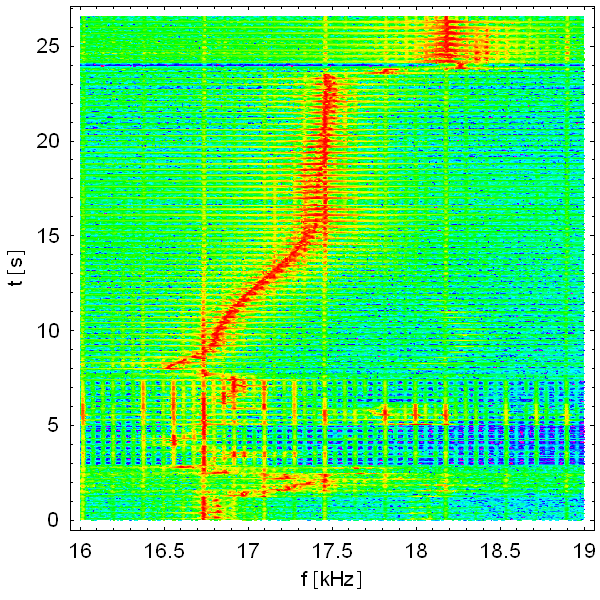
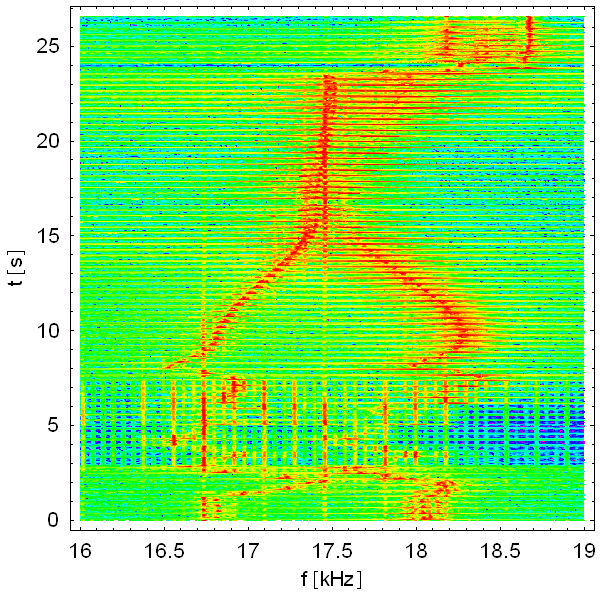
Below are the plots of the time domain signals (Fig. 1H, 1V), spectra in 3D (Fig. 2H, 2V), 2D spectra plots with common normalisation (Fig. 3H, 3V) and with each spectrum segment normalised separately (Fig. 4H, 4V). You can see that the "780 Hz lines" move at the beginning of the ramp, following the Frev shift (Frev = revolution frequency, about 78 kHz for RHIC). Please note also that tune oscillations get much better each time the tunes cross a "780 Hz line" (see the following 2D spectra), resulting from the fact that the IPM is firing every 100 turns (780 Hz = 1/100 of Frev of 78 kHz). This crossing means that the tune phase at the IPM is the same for each of the 100 IPM kicks (if I counted them well...) and this burst of kicks is then very efficient.
I performed a similar procedure, cutting-out 0.3 s pieces related to oscillations made by the tune kicker.
This is the re-sampled (8 kS/s) .wav file (26 s, 0.8 MB).
Similarily to the IPM, below are plots corresponsing to the tune kicker signals and their spectra. Time domain signals are shown in Fig. 5H and 5V, corresponding to H and V planes, respectively. 3D spectra plots are shown in Fig. 6H and 6V, contour plots with common normalisation in Fig. 7H and 7V and with normalisation of each spectrum frame separately - in Fig. 8H and 8V.
It can be seen that the oscillations get much larger when the tunes sit at a harmonic of 60 Hz. "720 Hz lines" (12. harmonic of 60 Hz) seem to be the most efficient. Note that these "power supply lines" appear only in vicinity of the tunes. Therefore, they are indeed in the beam spectrum and they behave as true beam resonances. The lines are much more pronounced in the H plane, suggesting that they (most likely) originate form dipole power supplies and they get to the V plane through residual coupling.
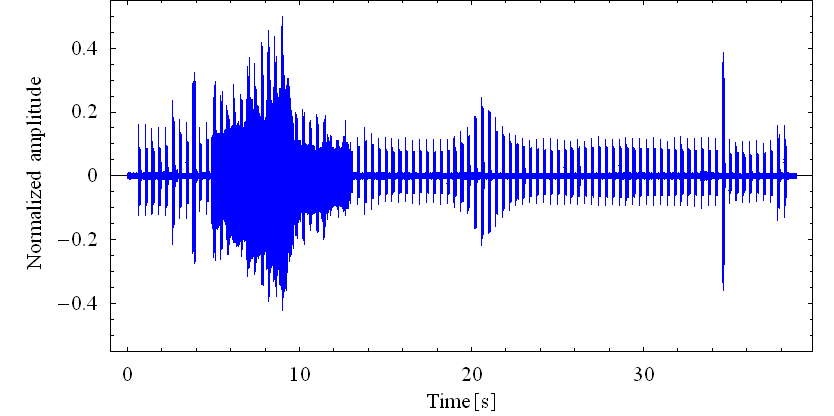
Fig. 1H. IPM H plane (L channel) time-domain processed signal.
It was made by selecting 0.4 s parts of the original 96 kS/s record with IPM activity every 4 s.
Therefore, the time axis is condensed by a factor of 10. They are 95 IPM kicks in the whole record.
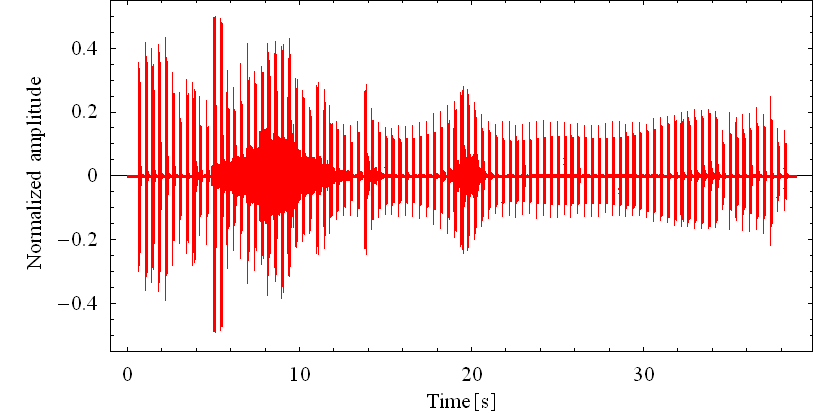
Fig. 1V. IPM V plane (R channel) time-domain processed signal. Comments as for the corrseponding H plot on the left.
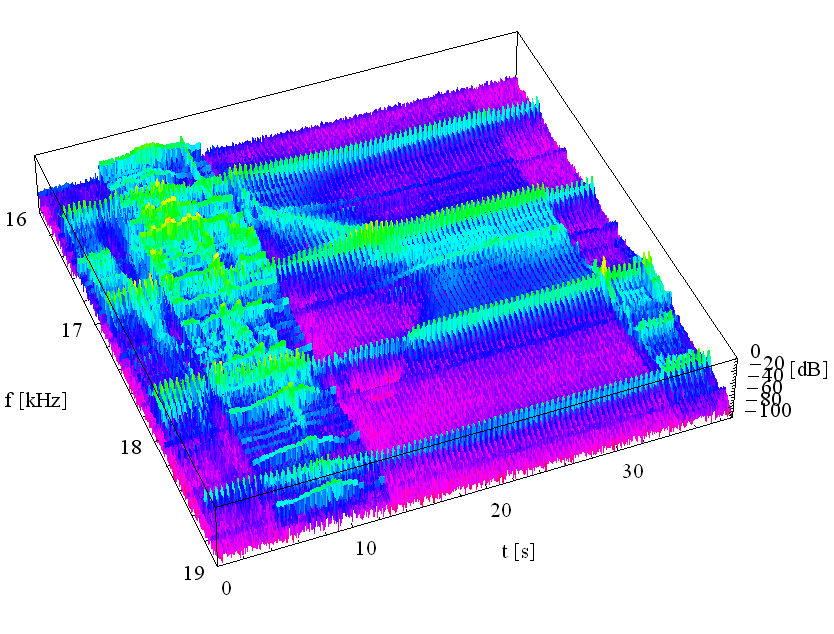
Fig. 2H. 3D spectra of the above IPM signal, H plane.
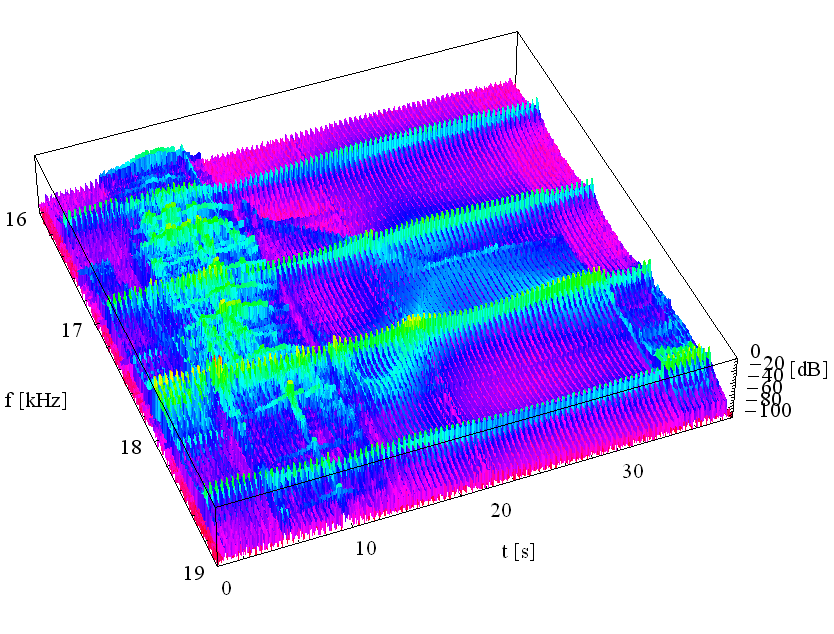
Fig. 2V. 3D spectra of the above IPM signal, H plane.
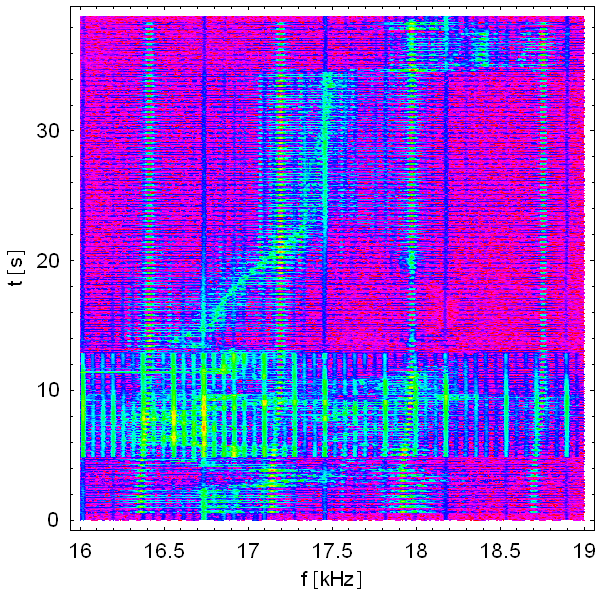
Fig. 3H. Contour plot of the spectra of the above IPM signal, H plane. All spectrum frames are normalised to one maximum value.
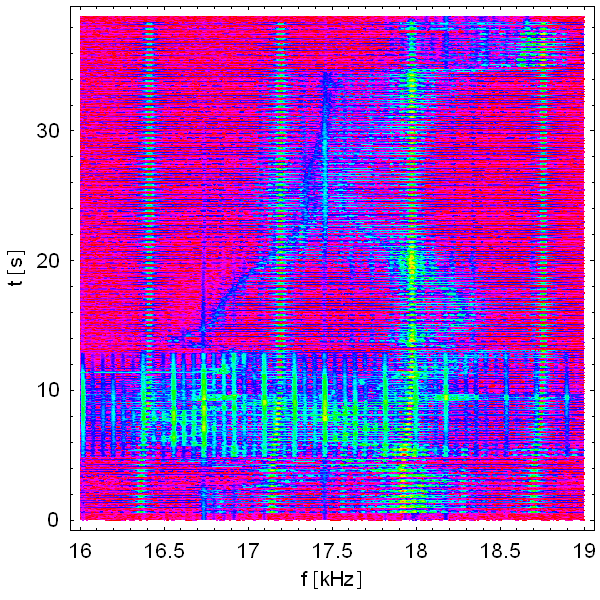
Fig. 3V. Contour plot of the spectra of the above IPM signal, V plane, noprmalised as the corresponding H plot.
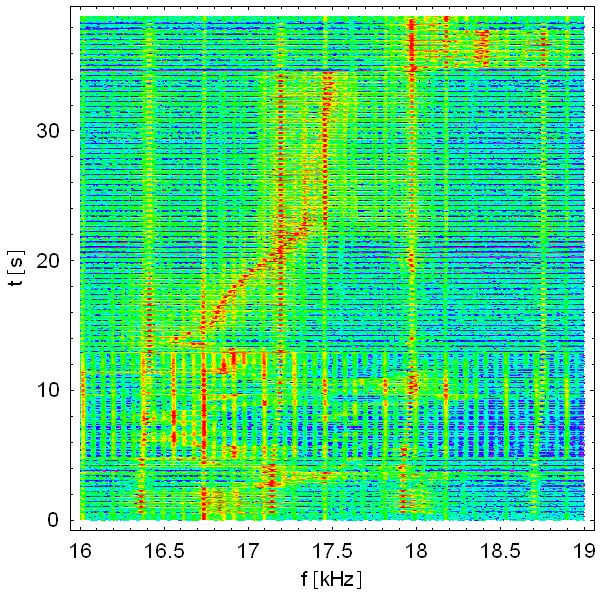
Fig. 4H. Contour plot of the spectra of the above IPM signal, H plane. Each spectrum frame normalised separately.
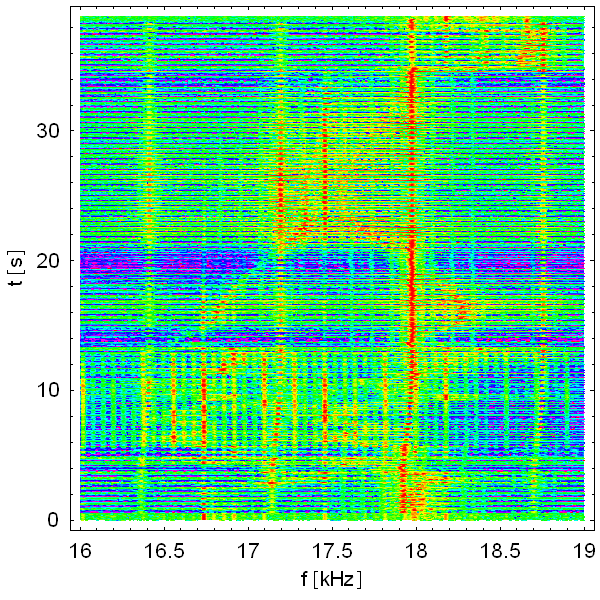
Fig. 4V. Contour plot of the spectra of the above IPM signal, V plane, noprmalised as the corresponding H plot.
